Projection for Data Visualization
The data are projected into a lower-dimensional space for visualization. They can be explored by displaying the instances projected in a plane defined by two components.
Usage
SecuML_projection <project> <dataset> <algo>.SecuML_projection <project> <dataset> <algo> -h.Annotations.
The annotations
(specified with -a GROUND_TRUTH or -a <partial_annotations>.csv)
are displayed in the GUI to focus on areas with known malicious
instances. This way, the projections can allow to detect new malicious
instances close to the known ones.
Moreover, the annotations can be leveraged by semi-supervised algorithms through metric learning to bring malicious instances closer. This way, it is even easier to detect unknown malicious instances with the 2D visualizations.
Algorithms Available
Unsupervised Algorithms
Semi-supervised Algorithms
Lmnn (metric-learn documentation)
Itml (metric-learn documentation)
Graphical User Interface
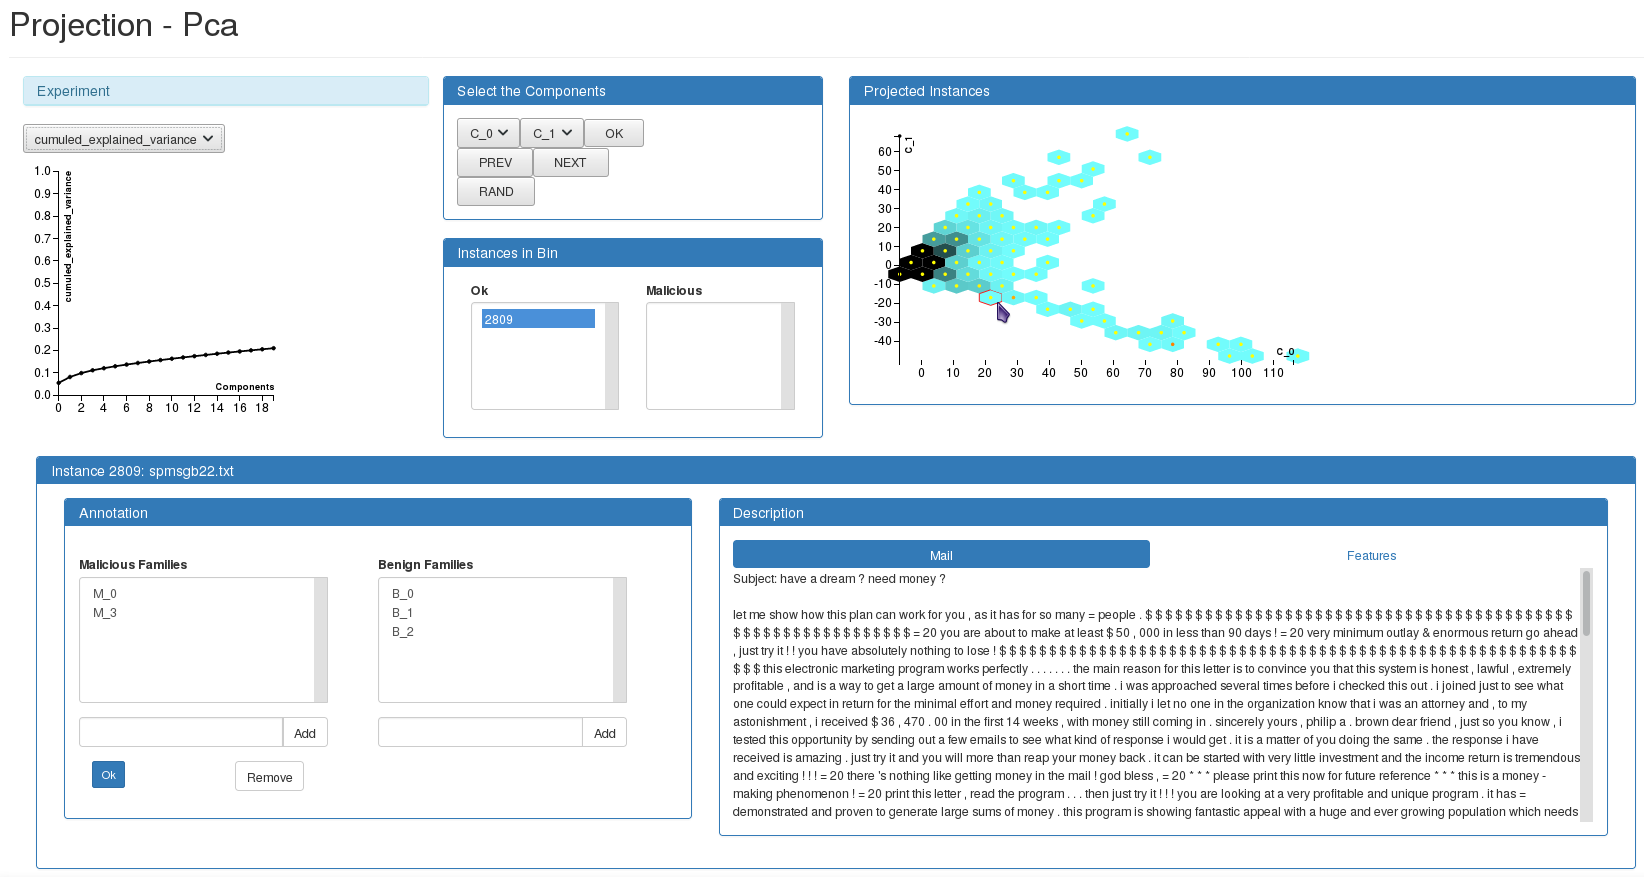
The instances are not displayed individually but with an hexagonal binning for scalability. The color of the bins, from blue to black, corresponds to the number of instances in the bins. The color of the dot in the middle of each bin (from yellow to red) corresponds to the proportion of known malicious instances in the bin. The orange and red dots allow to guide the exploration of the data close to known malicious instances.
Clicking on an hexagon displays its instances in the Description panel at the bottom.